Build a web-based transaction monitoring dashboard that displays transaction volumes, reconciliation status, and anomaly alerts.
28 minutes
What You'll Build
A single-page web app displaying daily transaction volumes, success/failure rates, and settlement status
A live local web server that auto-refreshes and picks up new data automatically
Color-coded anomaly indicators for unusual transaction patterns
Comparison charts showing performance across payment channels
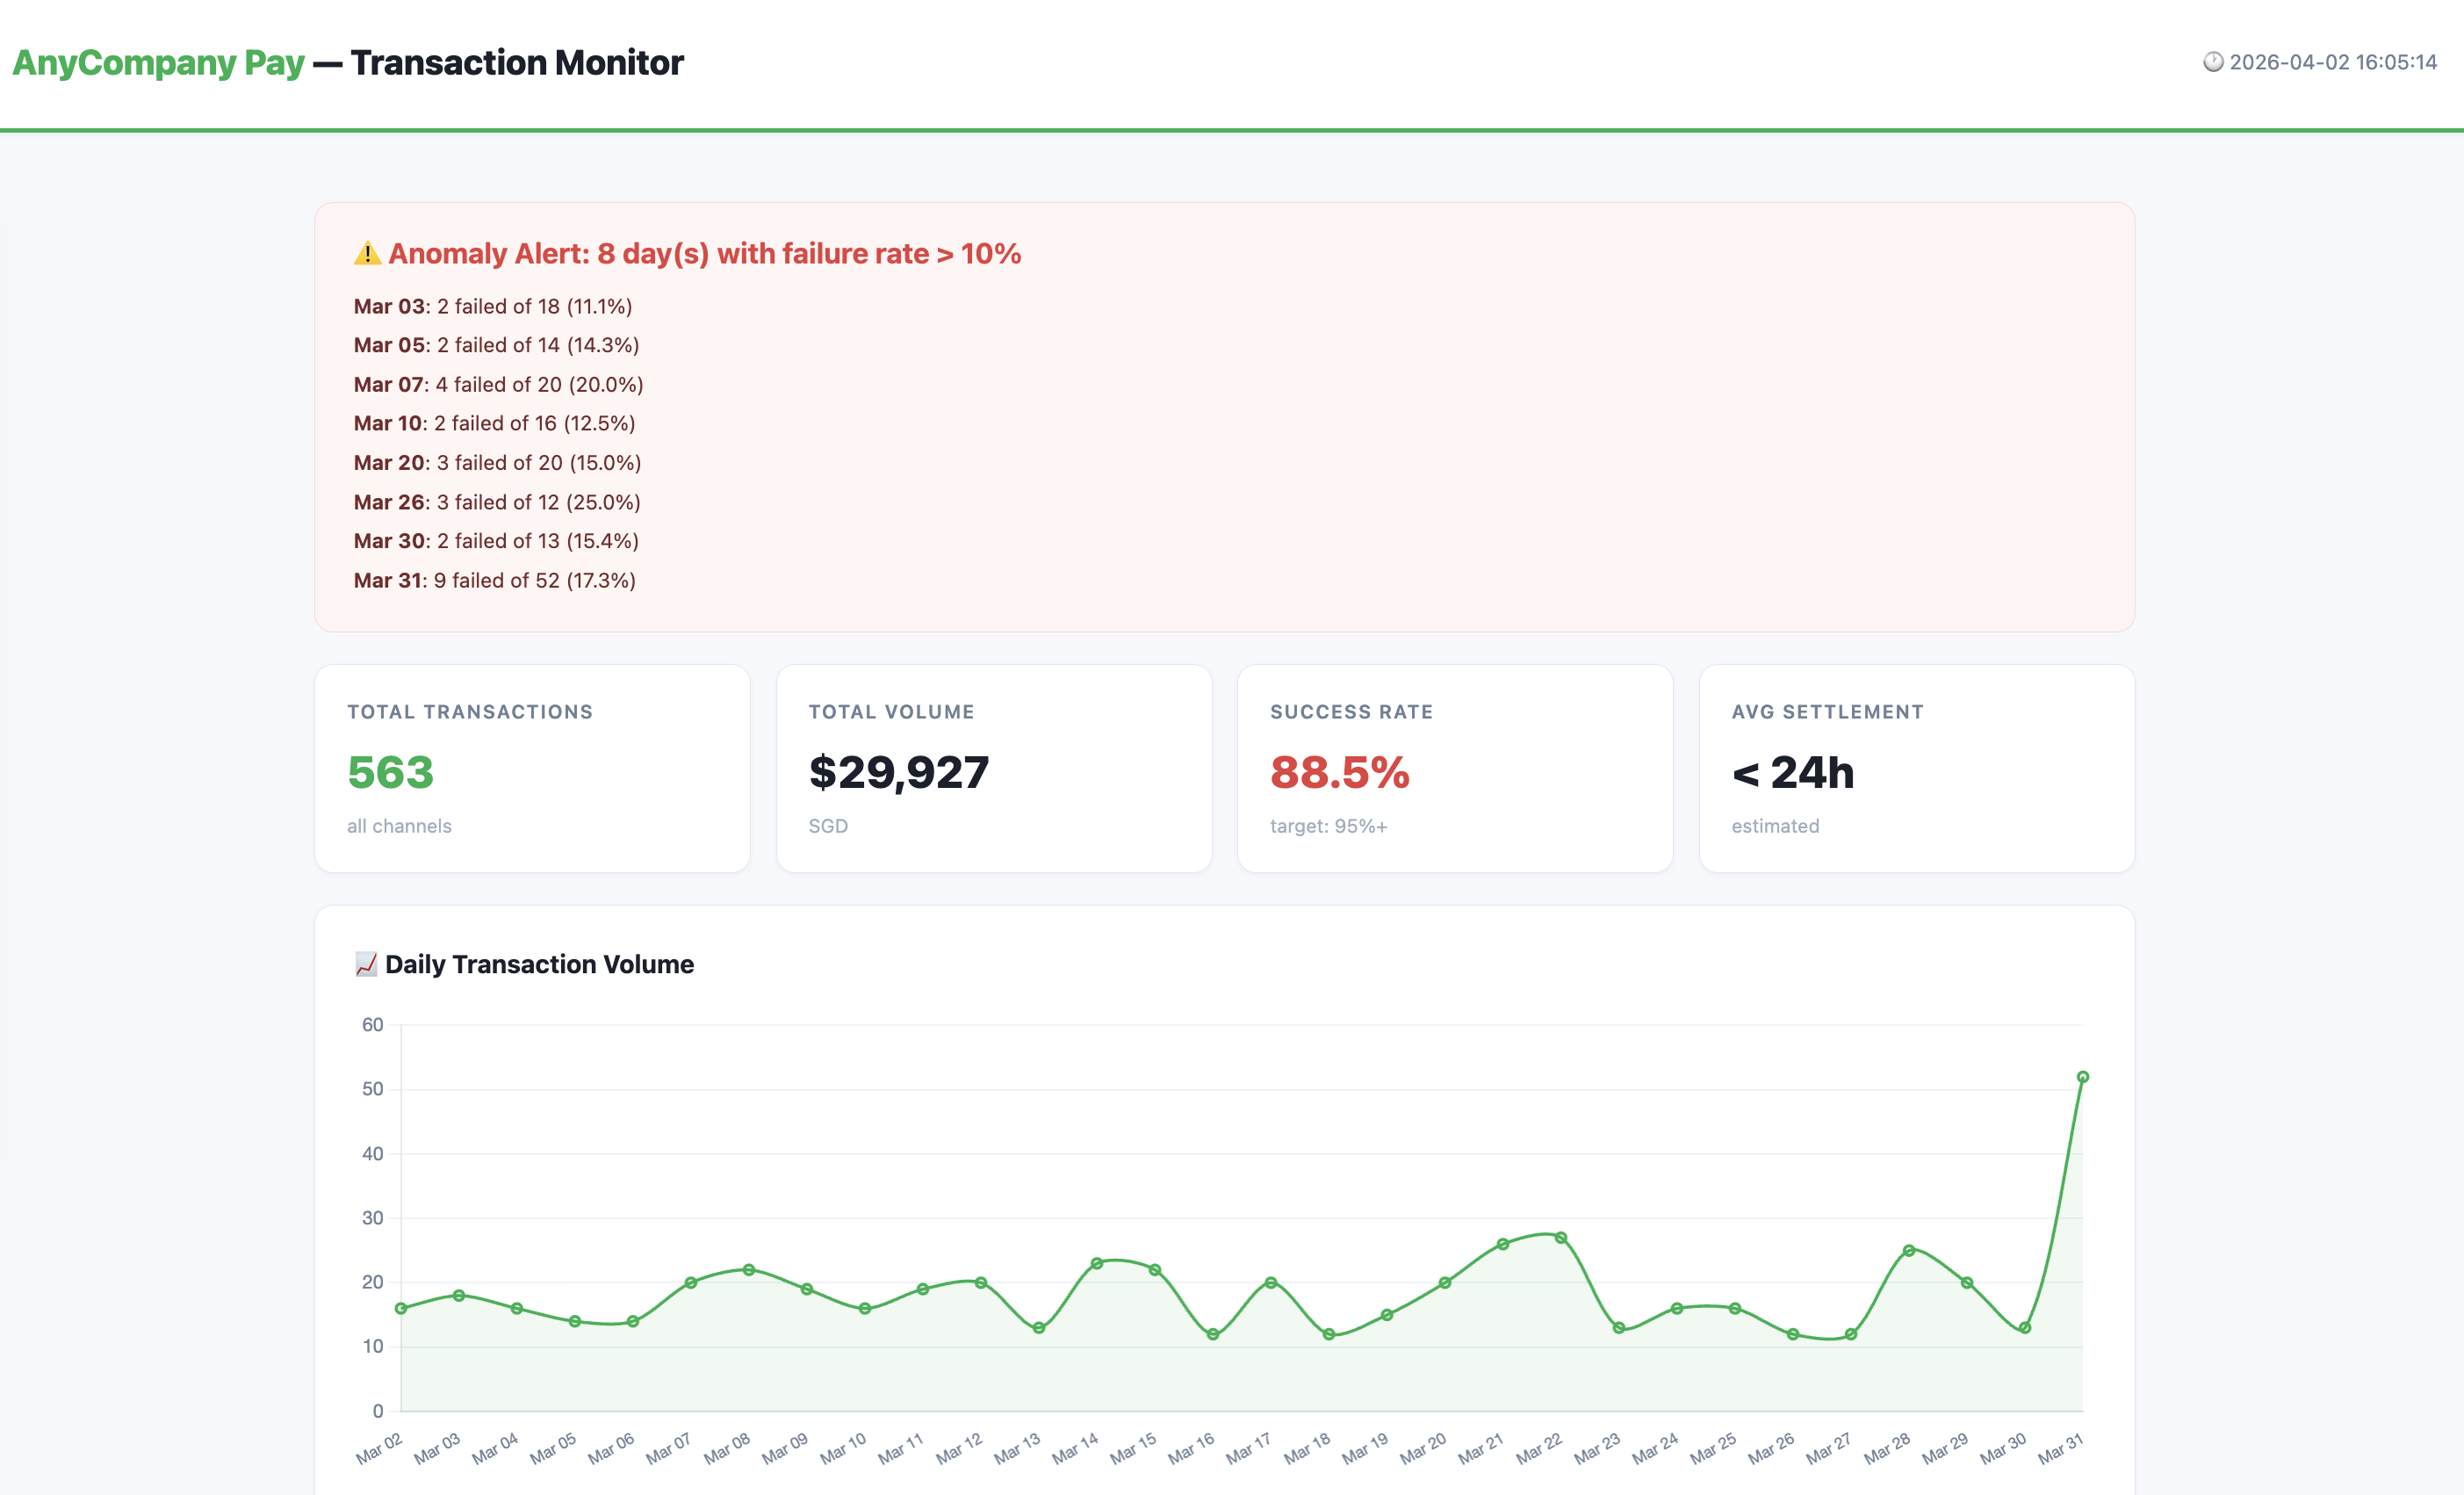
Preview: Transaction Dashboard
Here's what the finished dashboard looks like — served from localhost and auto-refreshing every 60 seconds:
Step
Duration
Description
Generate Transaction Data
3 min
Create realistic synthetic transaction data
Build the Dashboard Server
10 min
Build a live localhost dashboard that reads the data
Inject New Data
5 min
Add transactions while the server is running and watch it update
Add Reconciliation & Export
10 min
Add settlement tracking, channel performance, and CSV export
🛡️ Before You Start: Running Commands in Kiro
This lab asks Kiro to run Python scripts several times. Each time, you'll see a prompt at the bottom of the terminal:
Waiting on your input: RejectTrustRun
Run — executes the command once. You'll need to click this every time.
Trust — allows Kiro to run commands in this session without asking again. Recommended for this lab since we'll run scripts multiple times.
Reject — cancels the command if something looks wrong.
💡 Tip: Click Trust at the first prompt to keep the lab flowing smoothly. You can always start a new session to reset trust.
Step 1: Generate Transaction Data
First, let's create realistic synthetic transaction data. In the Kiro chat panel, start a New Session in Vibe mode and paste:
PROMPT — Copy & paste into Kiro
Create a folder called "lab2-transaction-dashboard" in the current workspace.
Build a Python script called generate_data.py that creates a file called transactions.csv with 500 synthetic payment transactions for the last 30 days.
Each transaction should have these fields:
date, timestamp, transaction_id, merchant_name, amount_sgd, currency, payment_channel, status, settlement_status
Requirements:
- payment_channel: one of "Digital Wallet", "Credit Card", "Debit Card", "BNPL" (weighted 40%, 30%, 20%, 10%)
- status: "success" (92%), "failed" (5%), "pending" (2%), "refunded" (1%)
- settlement_status: "settled", "pending", or "delayed" (only successful transactions can be settled)
- amount_sgd: average $45, range $2 to $500
- Higher transaction volumes on weekends (Sat/Sun)
- Inject 2 anomaly days with unusually high failure rates (>15%) to simulate payment gateway issues
- Use realistic merchant names (e.g., "FreshMart Express", "TechZone SG", "CloudKitchen Asia")
- transaction_id format: TXN-000001
Run the script and print a summary showing: total transactions, date range, status breakdown, and which days are anomaly days.
✅ Checkpoint: transactions.csv created with 500 transactions · Summary shows ~92% success rate · 2 anomaly days identified with >15% failure rate
Step 2: Build the Dashboard Server
Now let's build a live dashboard that reads this data. In the same chat session, paste:
PROMPT — Copy & paste into Kiro
You are a Payment Operations Manager responsible for monitoring transaction health across all payment channels. You need clear visibility into daily volumes, failure rates, and settlement status.
Build a Python script called dashboard.py in the "lab2-transaction-dashboard" folder that serves a transaction monitoring dashboard on localhost.
The script should:
- Read transactions.csv on every page request (so it picks up new data automatically)
- Serve a single HTML page using Python's built-in http.server
- Use Chart.js via CDN for all charts
Dashboard layout (clean, bright white theme with green #00B14F accent):
- Use white (#FFFFFF) cards on a light gray (#F7F8FC) page background with dark text (#2D3748). Ensure all text has high contrast and readability on the light background. Use subtle borders (#E2E8F0) and shadows for card separation.
- Header: "AnyCompany Pay — Transaction Monitor" with current date/time
- Summary cards row: Total Transactions, Total Volume (SGD), Success Rate, Avg Settlement Time
- Anomaly alert banner: If any day has failure rate > 10%, show a prominent alert with a light red background (#FFF5F5) and dark text, listing each anomaly date with its failure count and rate
- Line chart: Daily transaction volume over 30 days
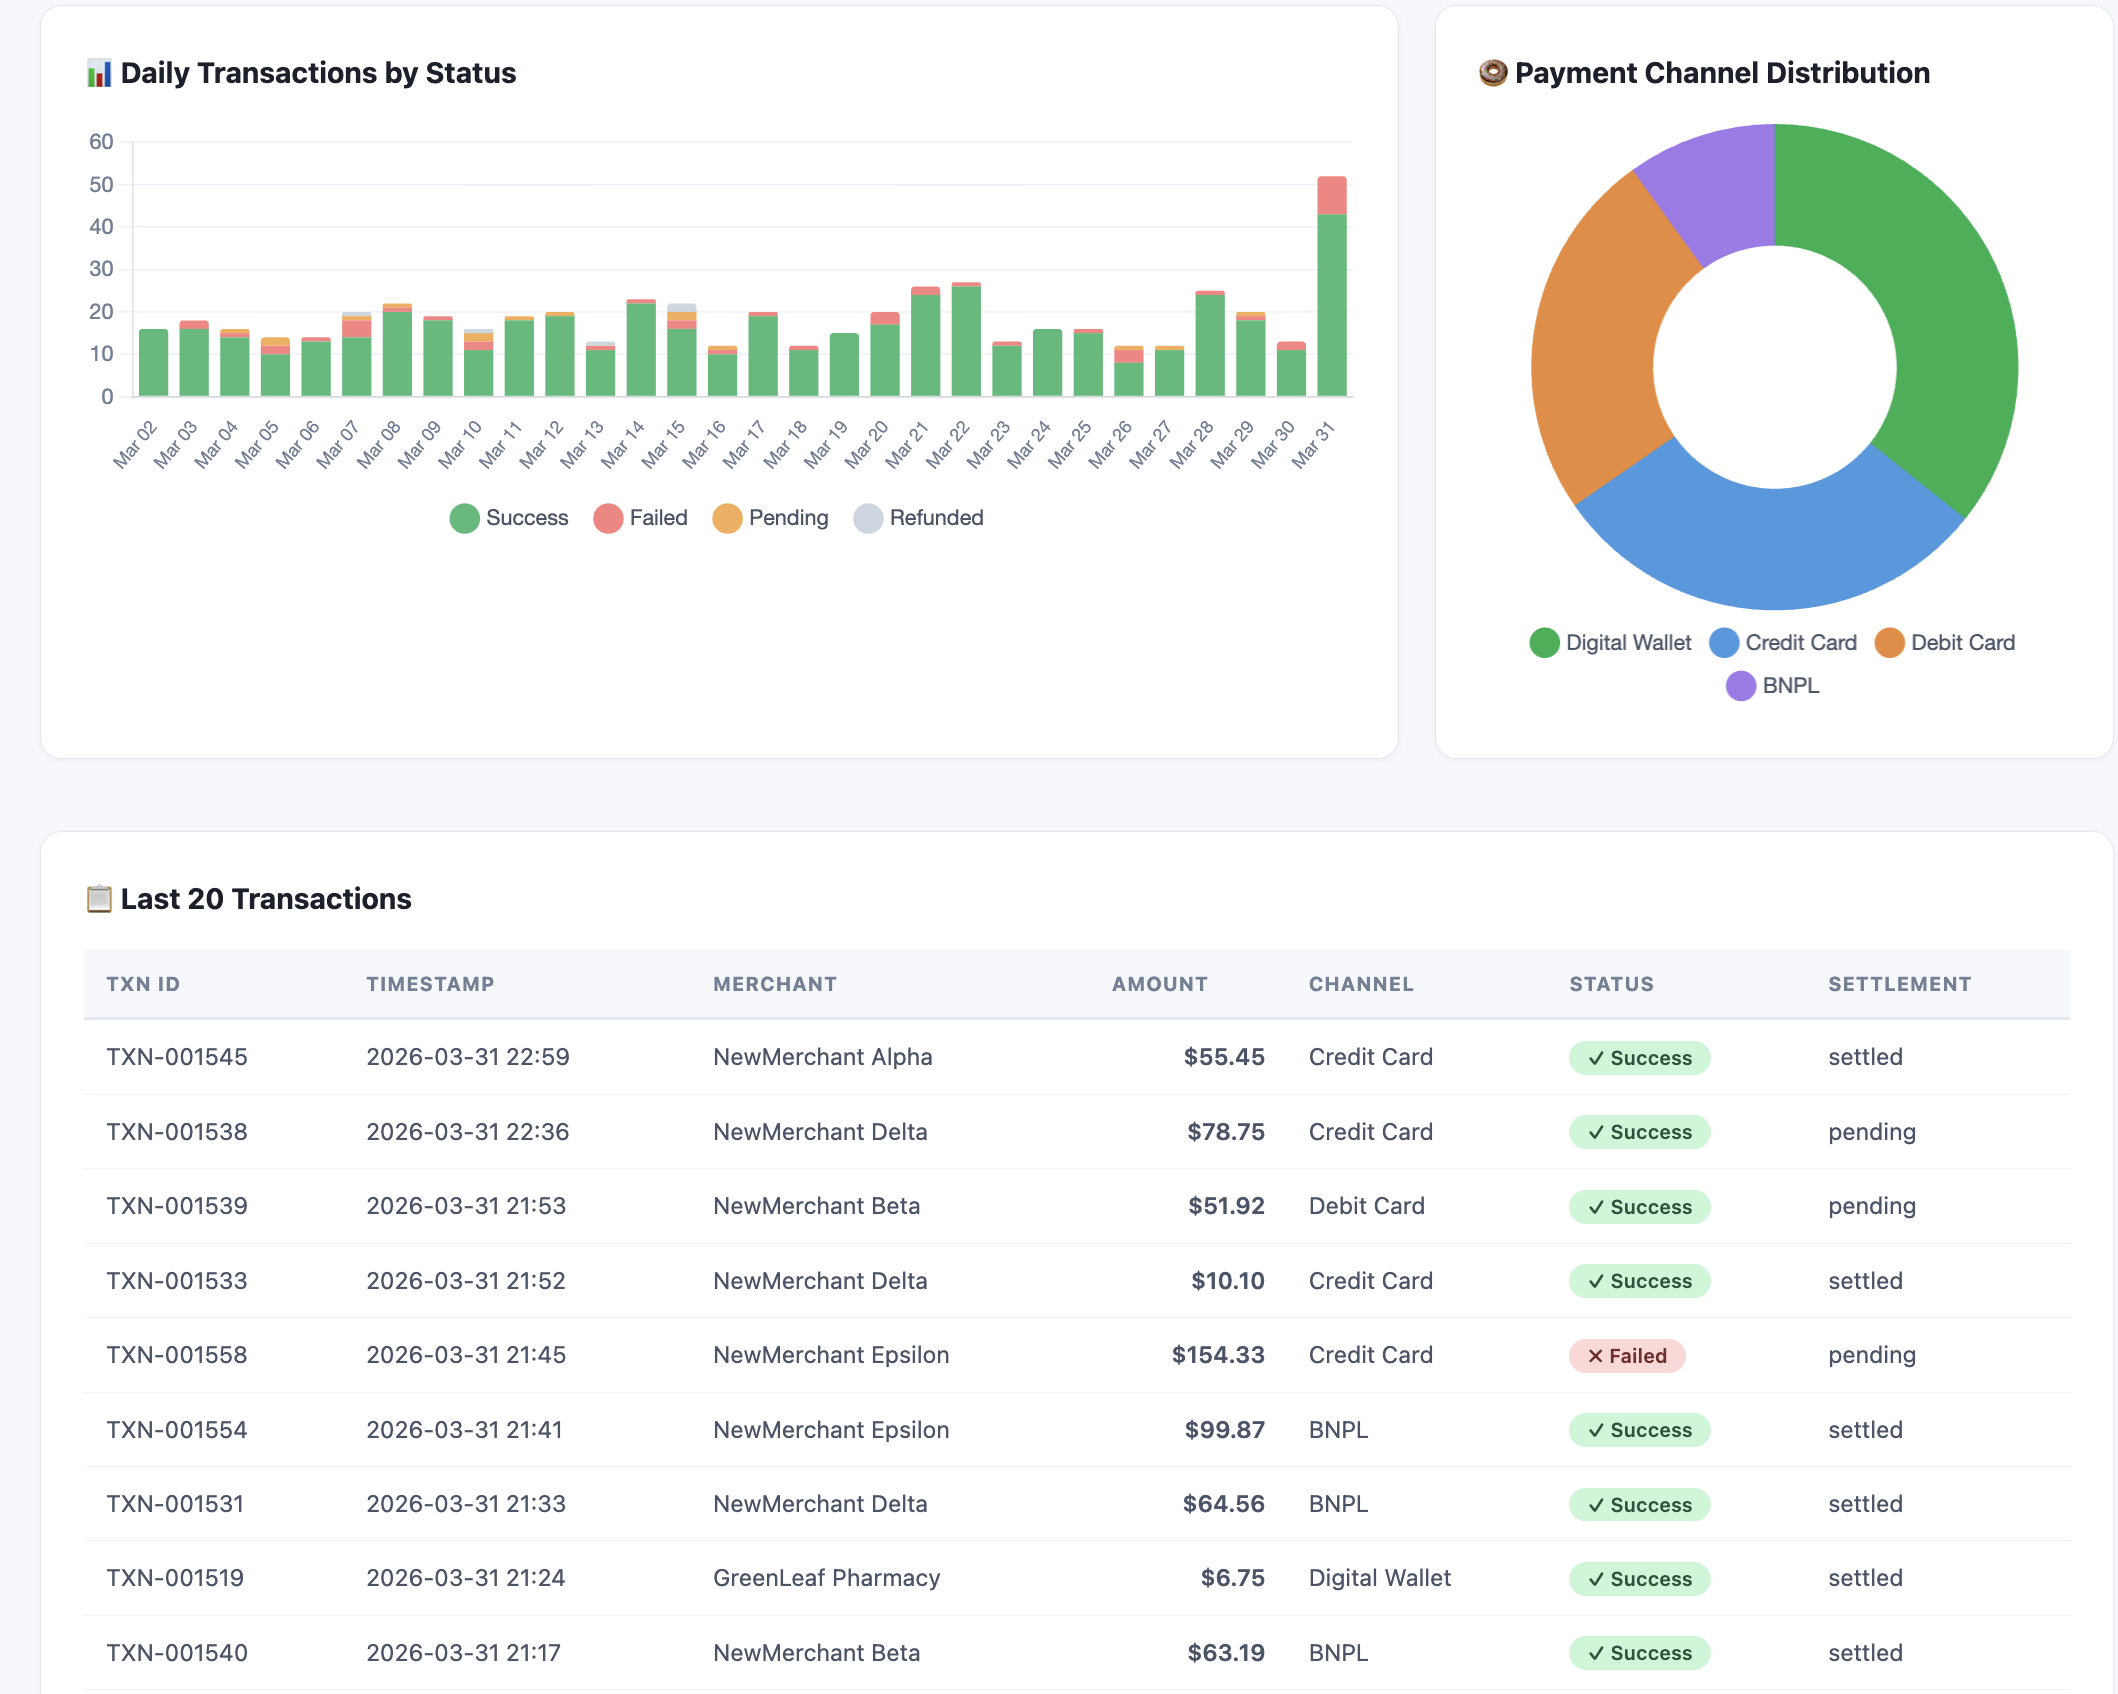
- Stacked bar chart: Daily transactions by status (success=green, failed=red, pending=orange, refunded=gray)
- Pie/doughnut chart: Transaction distribution by payment channel
- Table: Last 20 transactions with color-coded status badges
- Auto-refresh every 60 seconds
- Footer: "AnyCompany Pay Operations Dashboard — Data refreshed at [timestamp]"
Install pandas automatically if needed. Run the script to start the server and open the dashboard in the browser.
✅ Checkpoint: Server running on localhost · Dashboard showing summary cards, charts, and transaction table · Anomaly days flagged with readable alert banner
🌐 Open the dashboard manually
Kiro will start the server and you'll see something like Serving on http://localhost:8050 in the terminal. The browser may not open automatically on the remote desktop.
To view the dashboard: Open Firefox from the taskbar inside the DCV session, then go to http://localhost:8050
💡 Tip: Keep the browser open side-by-side with Kiro — the dashboard auto-refreshes every 60 seconds, so you'll see changes appear as you continue the lab.
💡 Why a local web server?
Unlike Module 1 which generated a static HTML file, this module runs a live web server on your machine. This is useful because:
The dashboard re-reads transactions.csv on every page load — if the data changes, the dashboard updates automatically
The auto-refresh (every 60 seconds) means you can leave it open and it stays current — just like a real monitoring dashboard
This pattern is how many internal business tools work — a simple Python script serving a dashboard that anyone on the team can access
Step 3: Inject New Data and Watch the Dashboard Update
With the server still running, let's add new transactions and see the dashboard pick them up automatically. Open a new Kiro chat session (keep the server running in the previous session) and paste:
PROMPT — Copy & paste into Kiro
Create a Python script called inject_transactions.py in the "lab2-transaction-dashboard" folder that:
1. Reads the existing transactions.csv
2. Appends 50 new transactions for today's date with these patterns:
- 30 successful transactions (normal amounts $10-$100)
- 10 failed transactions (to simulate a payment gateway issue)
- 5 pending transactions
- 5 refunded transactions
- Use a mix of all payment channels
- Use merchant names like "NewMerchant Alpha", "NewMerchant Beta" so they're easy to spot
3. Saves the updated transactions.csv
4. Prints a summary: "Injected 50 new transactions. Total now: X. Today's failure rate: Y%"
Run the script. Then go back to the browser — the dashboard will auto-refresh within 60 seconds and show the updated data, including a new anomaly alert for today's high failure rate.
✅ Checkpoint: 50 new transactions injected · Dashboard auto-refreshed with updated totals · Today appears as a new anomaly day (20% failure rate)
Step 4: Add Reconciliation View and Export
In the same chat session, paste:
PROMPT — Copy & paste into Kiro
Update dashboard.py to add two new sections to the dashboard:
1. "Settlement Reconciliation" section:
- A table grouped by date showing: total transactions, settled count, pending count, delayed count, settlement rate %
- Highlight any day with settlement rate below 95% in yellow with dark text for readability
- Show a bar chart of daily settlement rates
2. "Channel Performance" section:
- A comparison table: payment channel, transaction count, total volume, success rate, avg amount
- Highlight the best-performing channel in green and worst in red
3. Add a "Download CSV Report" button at the top that exports the full transaction data with a reconciliation status summary appended.
Restart the server after updating. Ensure all sections use the same bright white theme with high contrast text.
💾 Before You Continue: Create a Restore Point
Your dashboard is working well right now — Step 5 will make significant changes to dashboard.py. AI agents can sometimes break things when editing complex files, so let's save a backup first.
Option B — Use Kiro's built-in Revert:
After Kiro makes changes, you'll see a "Revert Changes" button in the chat. Click it to undo everything Kiro just did — like "Ctrl+Z" for the whole edit.
🎯 Why this matters: In real projects, AI agents edit your files directly. Having a rollback strategy — whether it's a file copy, git commit, or Kiro's revert — is essential. This is the "safety net" we covered in the Day 2 slides.
Step 5 (Optional): Make It Interactive
Take the dashboard to the next level with interactive features. In the same chat session, paste:
OPTIONAL PROMPT — Interactive Features
Update dashboard.py to add interactive features to the dashboard:
1. Transaction Table Filtering:
- Add a filter bar above the transaction table with:
- A dropdown to filter by status (All, Success, Failed, Pending, Refunded)
- A dropdown to filter by payment channel (All, Digital Wallet, Credit Card, Debit Card, BNPL)
- A text search box to filter by merchant name
- Filters should work client-side using JavaScript (no page reload needed)
- Show a count of matching results: "Showing X of Y transactions"
2. Chart-to-Table Drill-Down:
- When a user clicks on a bar in the "Daily Transactions by Status" stacked bar chart, update the transaction table below to show only transactions from that specific date
- Show a "Viewing: [date]" label above the table when filtered, with a "Clear filter" button to reset
- Use Chart.js onClick event handler for this
3. Status Summary Cards Click:
- When a user clicks on the "Failed" or "Pending" summary card at the top, filter the transaction table to show only that status
Keep all interactive features working with the auto-refresh. Use only client-side JavaScript — no additional server endpoints needed.
Restart the server after updating.
What You Accomplished
📊 Built a live transaction monitoring dashboard served from localhost
🔍 Generated realistic synthetic data with anomaly patterns
🔄 Injected new data and watched the dashboard update automatically
⚠️ Automated anomaly detection with visual alerts
💰 Added settlement reconciliation tracking and channel performance
📁 Added CSV export for downstream reporting
🖱️ (Optional) Added interactive filtering and chart drill-down
You've built a real-time monitoring tool with interactive features — the same pattern used by internal dashboards at many companies. All from natural language descriptions.