What You'll Build
- A single-page web app displaying daily transaction volumes, success/failure rates, and settlement status
- A live local web server that auto-refreshes and picks up new data automatically
- Color-coded anomaly indicators for unusual transaction patterns
- Comparison charts showing performance across payment channels
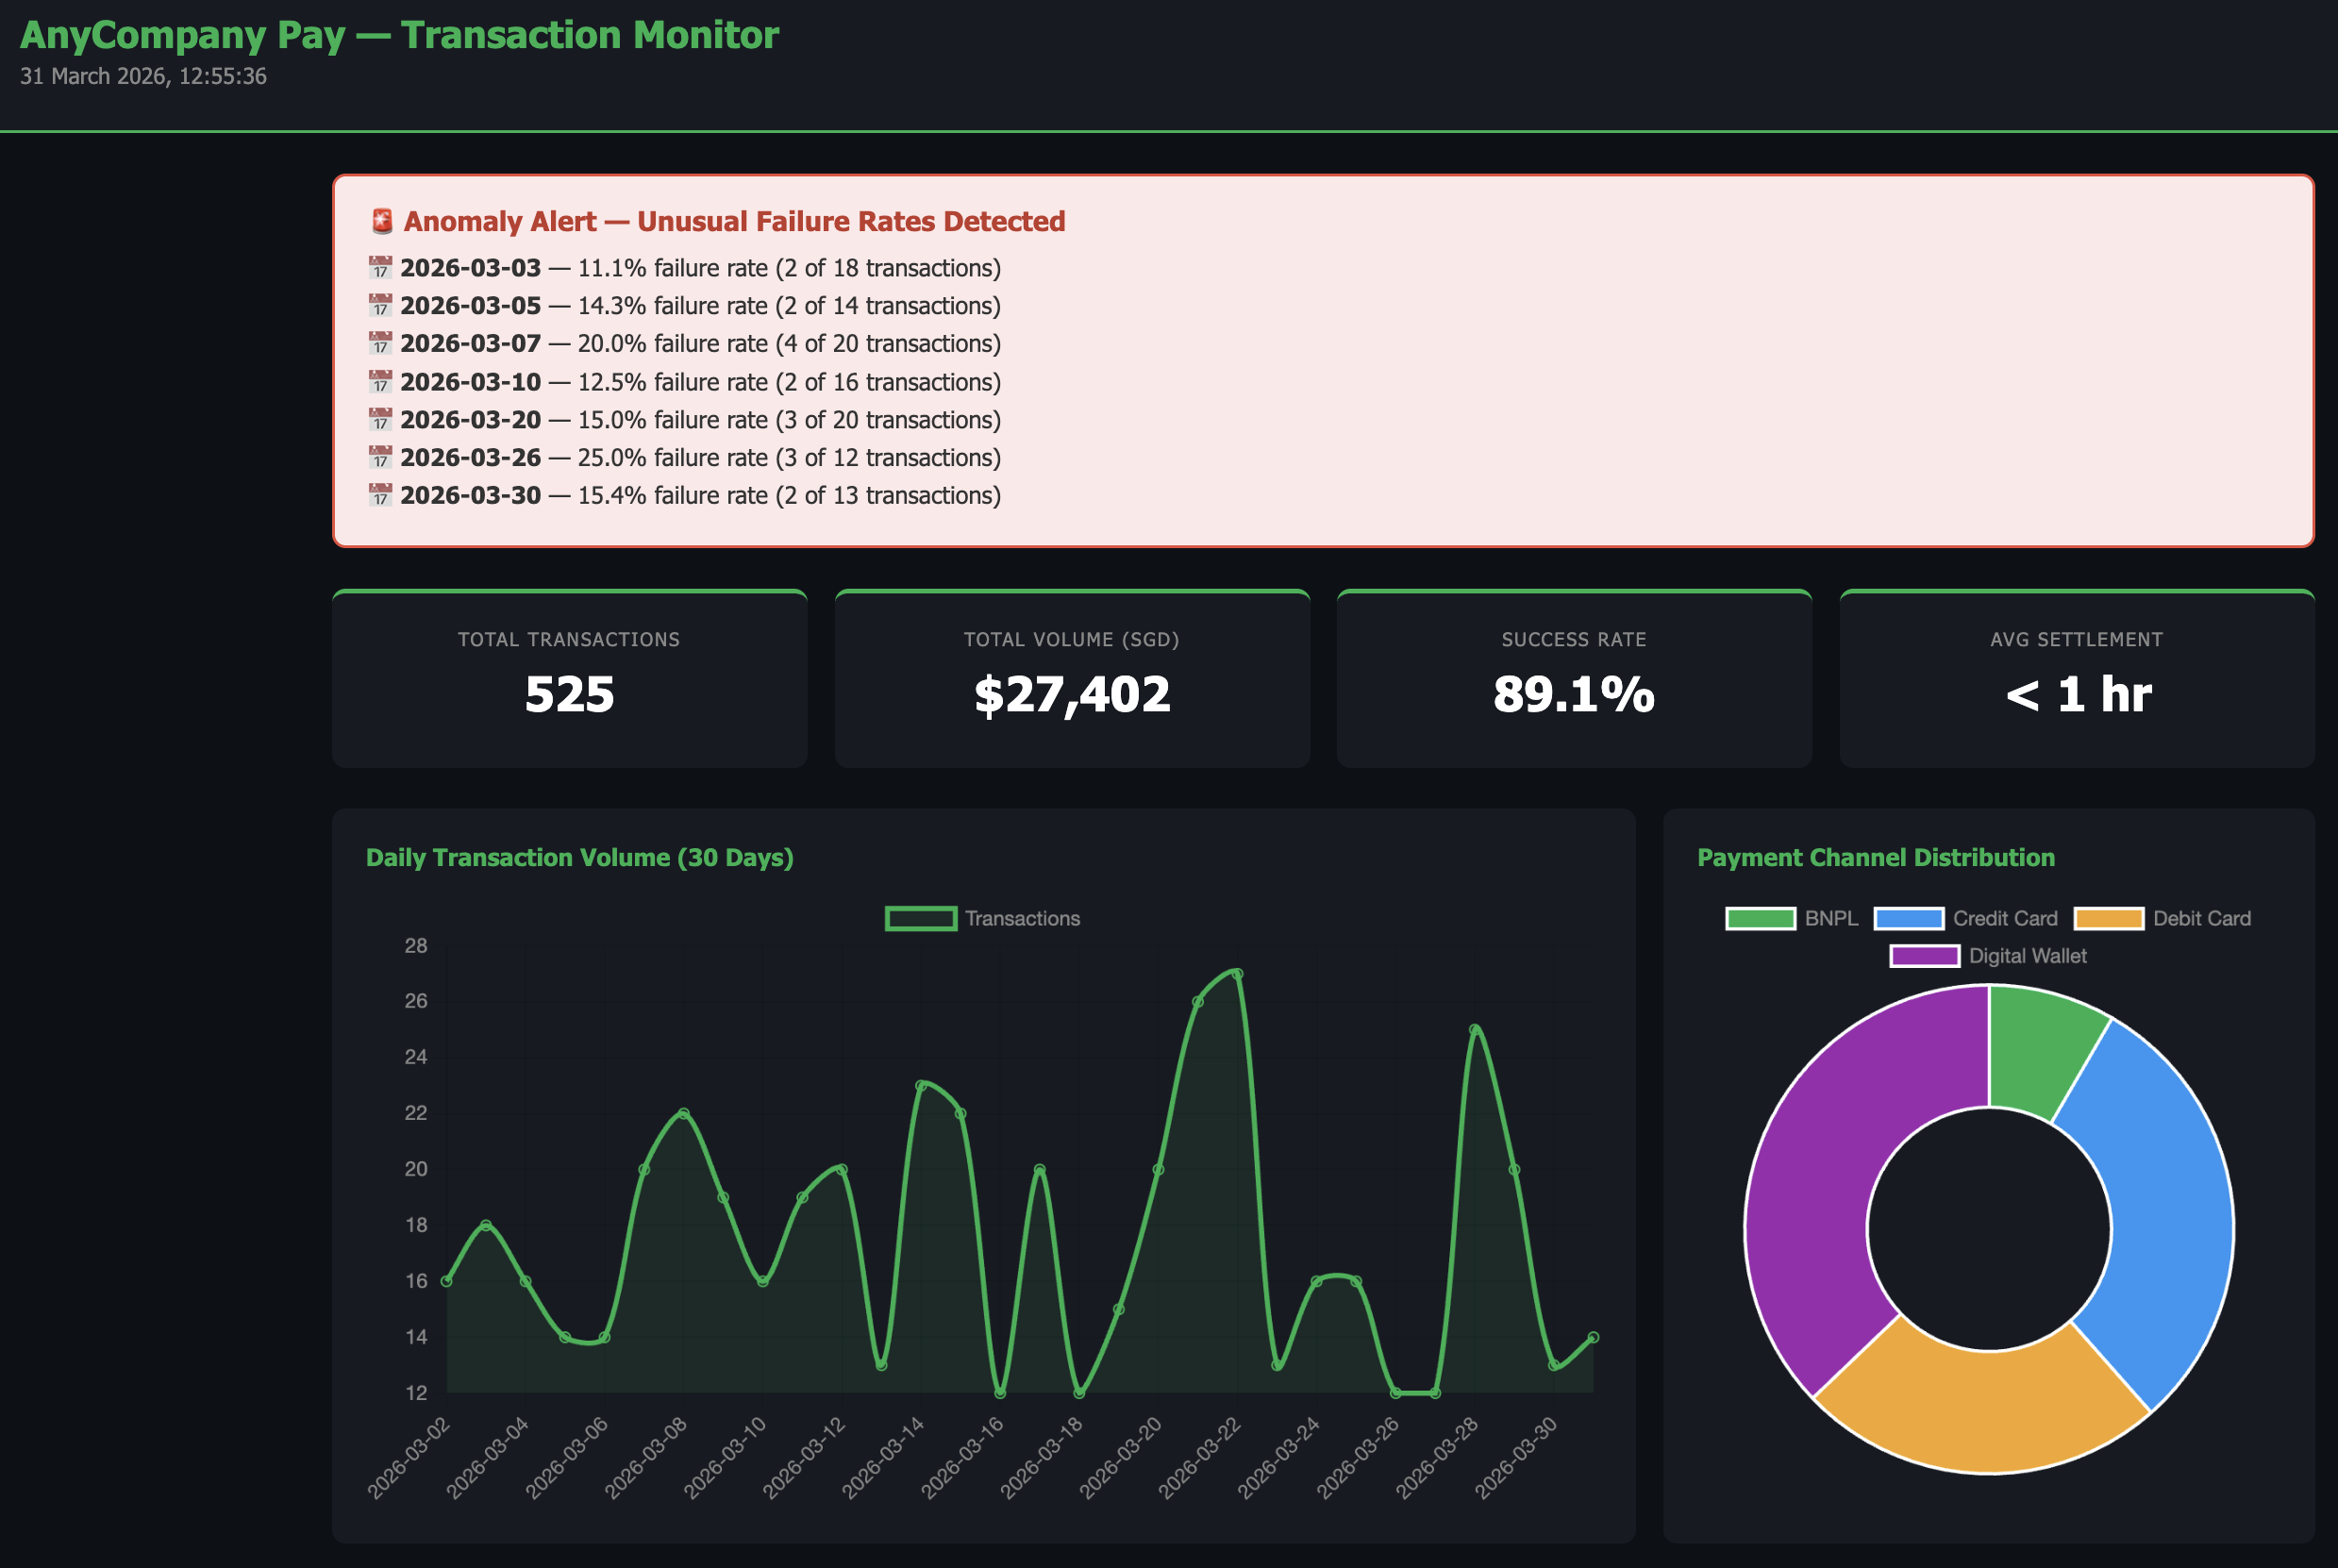
Preview: Transaction Dashboard
Here's what the finished dashboard looks like — served from localhost and auto-refreshing every 60 seconds:
| Step | Duration | Description |
|---|---|---|
| Generate Transaction Data | 3 min | Create realistic synthetic transaction data |
| Build the Dashboard Server | 10 min | Build a live localhost dashboard that reads the data |
| Inject New Data | 5 min | Add transactions while the server is running and watch it update |
| Add Reconciliation & Export | 10 min | Add settlement tracking, channel performance, and CSV export |
Step 1: Generate Transaction Data
First, let's create realistic synthetic transaction data. In the Kiro chat panel, start a New Session in Vibe mode and paste:
Step 2: Build the Dashboard Server
Now let's build a live dashboard that reads this data. In the same chat session, paste:
Unlike Module 1 which generated a static HTML file, this module runs a live web server on your machine. This is useful because:
- The dashboard re-reads transactions.csv on every page load — if the data changes, the dashboard updates automatically
- The auto-refresh (every 60 seconds) means you can leave it open and it stays current — just like a real monitoring dashboard
- This pattern is how many internal business tools work — a simple Python script serving a dashboard that anyone on the team can access
Step 3: Inject New Data and Watch the Dashboard Update
With the server still running, let's add new transactions and see the dashboard pick them up automatically. Open a new Kiro chat session (keep the server running in the previous session) and paste:
Step 4: Add Reconciliation View and Export
In the same chat session, paste:
Step 5 (Optional): Make It Interactive
Take the dashboard to the next level with interactive features. In the same chat session, paste:
What You Accomplished
- 📊 Built a live transaction monitoring dashboard served from localhost
- 🔍 Generated realistic synthetic data with anomaly patterns
- 🔄 Injected new data and watched the dashboard update automatically
- ⚠️ Automated anomaly detection with visual alerts
- 💰 Added settlement reconciliation tracking and channel performance
- 📁 Added CSV export for downstream reporting
- 🖱️ (Optional) Added interactive filtering and chart drill-down
You've built a real-time monitoring tool with interactive features — the same pattern used by internal dashboards at many companies. All from natural language descriptions.