What You'll Build
- A Python script that parses email threads (JSON) and project requirements (text)
- Extracts tasks, owners, dates, dependencies, and milestones from unstructured email content
- Generates a Gantt chart with color-coded phases, dependency arrows, and milestone markers
- Outputs a summary report with critical path, resource allocation, and risk flags
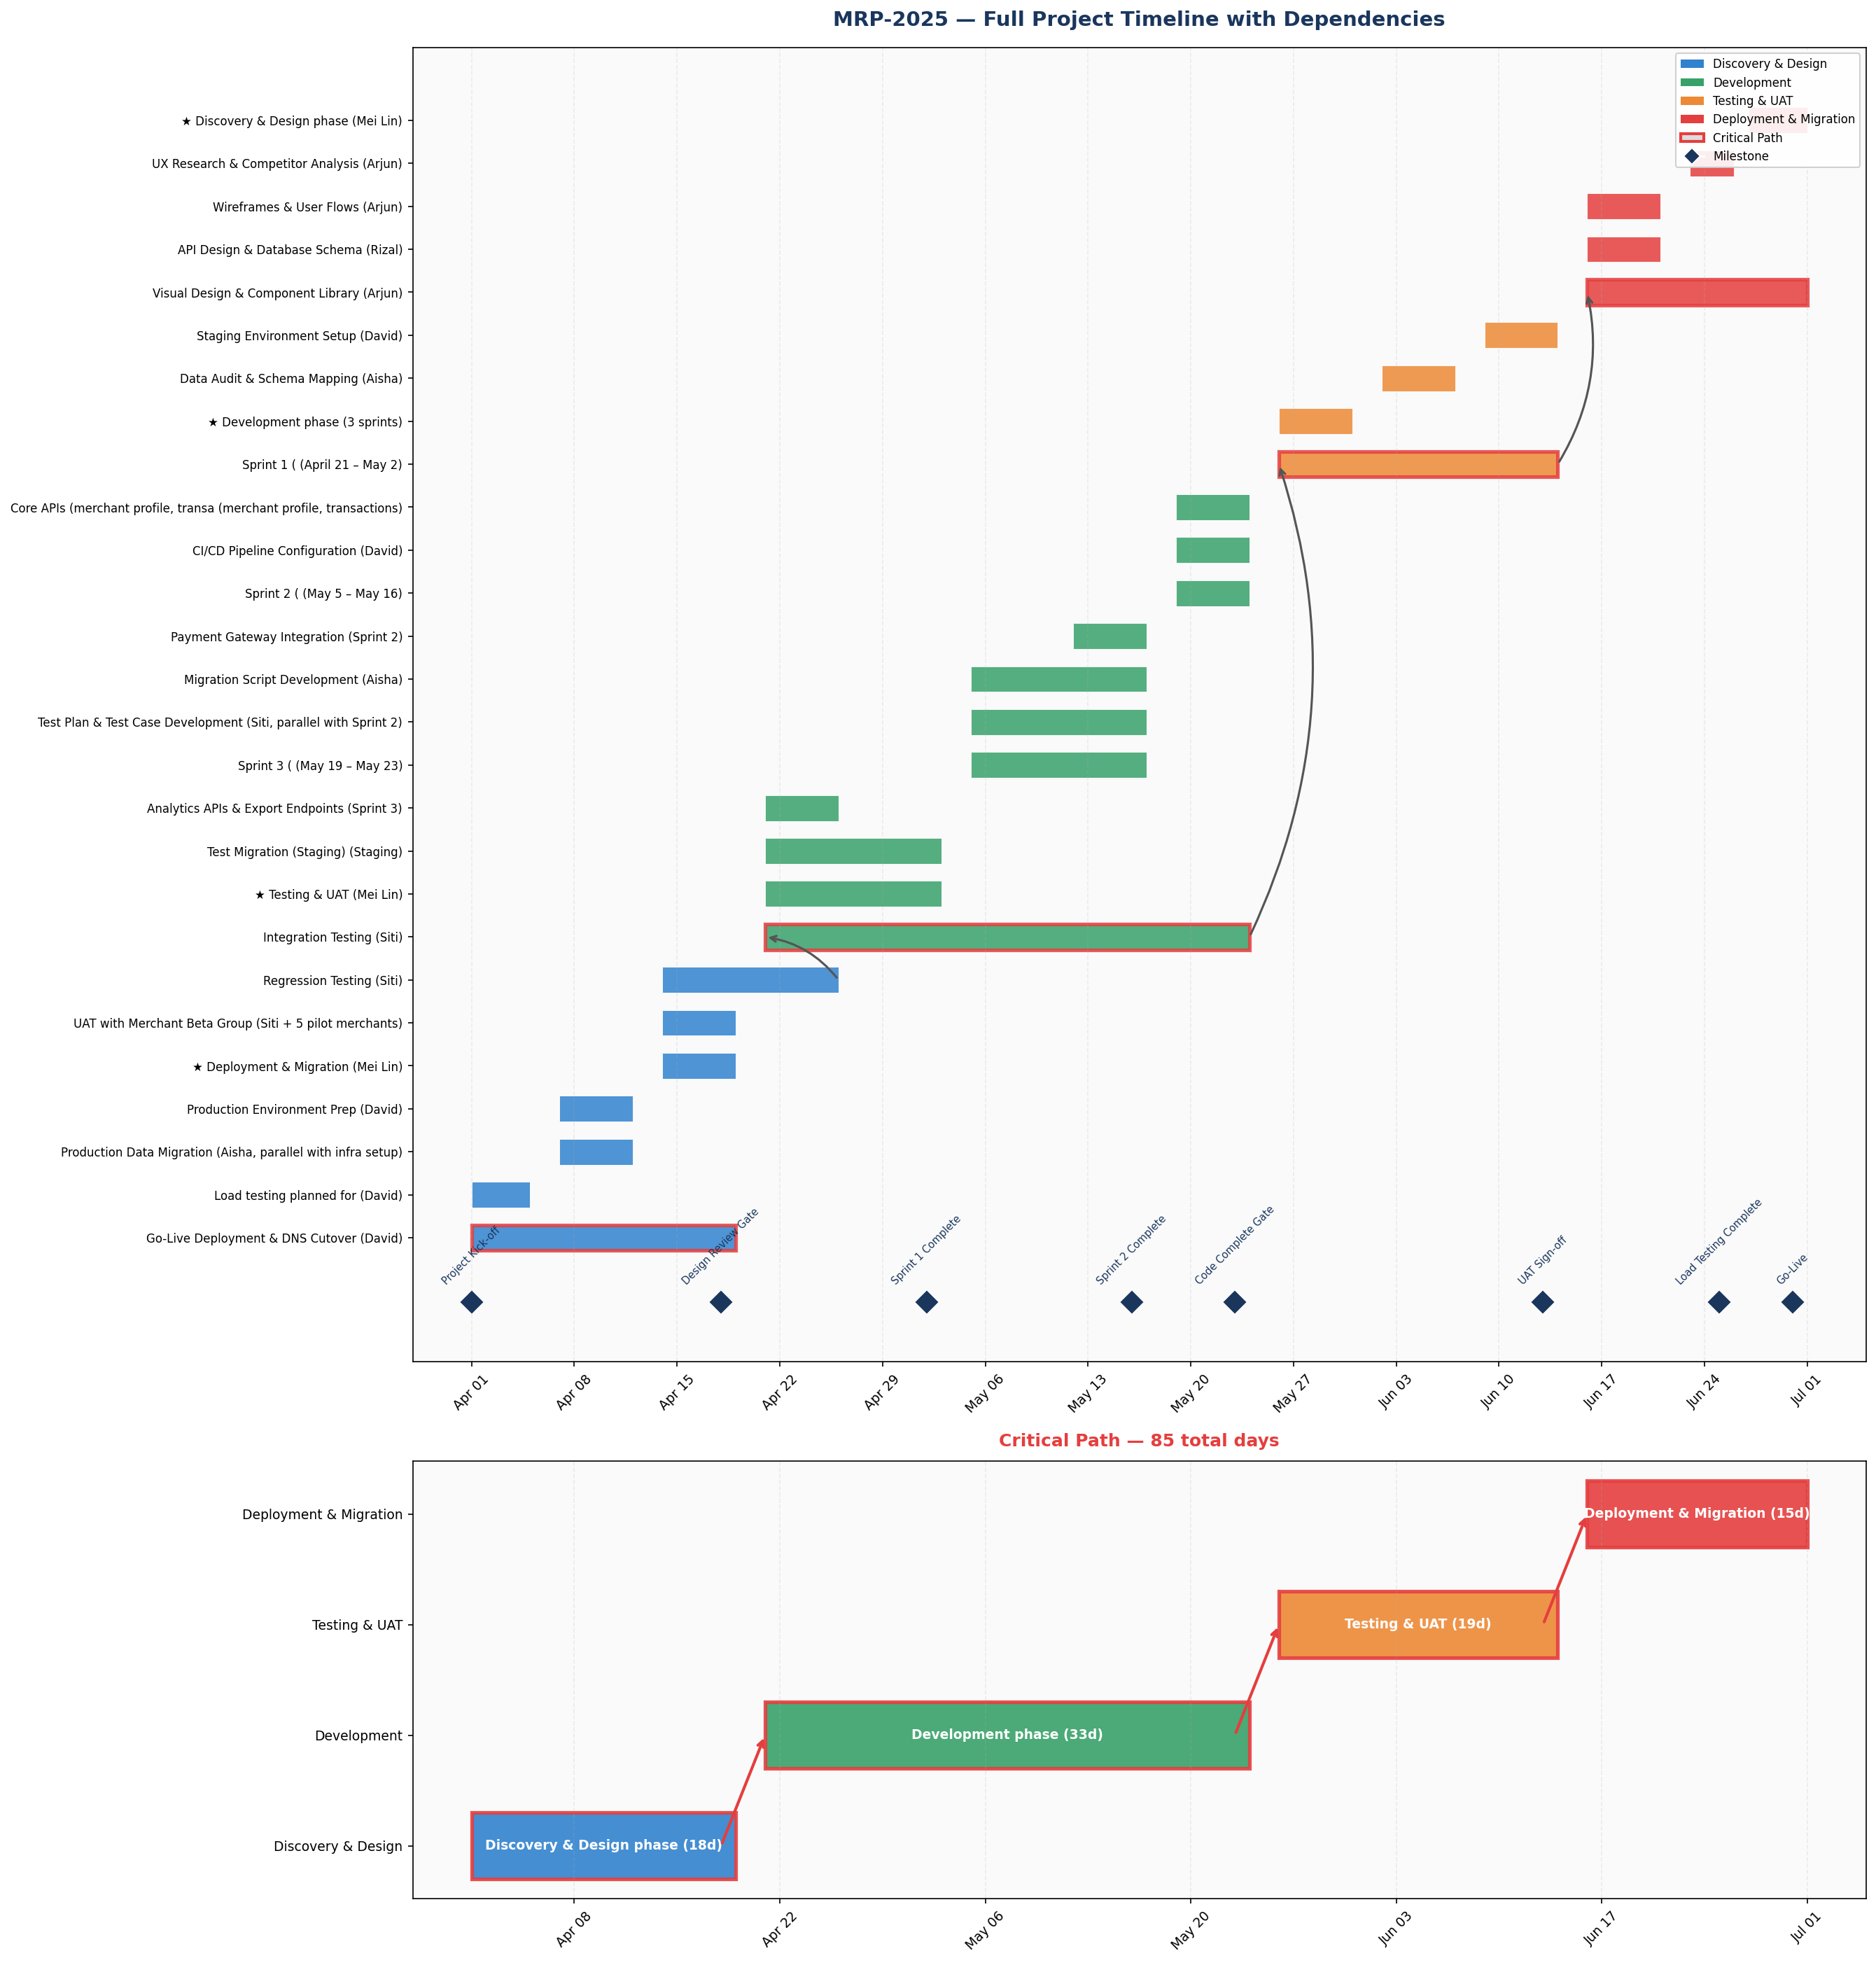
Preview: Generated Gantt Chart
Here's the Gantt chart you'll generate — extracted entirely from email threads and a project brief:
| Step | Duration | Description |
|---|---|---|
| Scenario & Sample Data | 5 min | Create realistic project emails and requirements |
| Build the Timeline | 15 min | Generate Gantt chart and project analysis |
| Refine & Export | 5 min | Add dependency arrows, HTML report, and delay simulation |
Step 1: Set Up the Scenario
The Business Problem: You're a project manager at AnyCompany Financial Group. Your team just kicked off the "Merchant Portal Redesign" — a 3-month initiative. You've received 8 emails from team members with scattered task breakdowns.
PROMPT — Copy & paste into Kiro
Create a folder called "project-planning" in the current workspace.
Inside it, create two files:
1. emails.json — A JSON array of 8 project emails for a "Merchant Portal Redesign" project:
- Realistic task breakdowns with specific dates (project runs April 1 to June 30, 2025)
- Team members: Mei Lin (PM), Arjun (Design Lead), Priya (Tech Lead), Rizal (Backend Dev), Thanh (Frontend Dev), Siti (QA Lead), David (DevOps), Aisha (Data Analyst)
- Dependencies between tasks (design must finish before frontend starts, etc.)
- A delay notification (payment API integration delayed 5 days due to vendor)
- Sprint planning details (3 development sprints)
- QA and UAT planning with merchant beta testing
- Data migration concerns for merchant transaction history
Each email should have: id, from, to, date, subject, body fields.
2. project_requirements.txt — A plain-text project brief with:
- Project code MRP-2025, sponsor VP of Payments, PM Mei Lin
- Budget $320,000 SGD, target go-live June 30, 2025
- 4 phases: Discovery & Design, Development, Testing & UAT, Deployment & Migration
- Key milestones with dates and gate/checkpoint types
- Team roster with allocation percentages
- 3 risks: payment API vendor delay, merchant data migration complexity, regional compliance differences (SG vs MY vs ID)
Make the content realistic and consistent between the two files.
✅ Checkpoint: emails.json with 8 project emails · project_requirements.txt with project brief
Step 2: Build the Timeline Generator
📦 What is matplotlib?
You'll see the prompt mentions "matplotlib" — this is a popular Python library for creating charts and visualizations (bar charts, line charts, Gantt charts, etc.). Think of it as the engine that draws the chart image. You don't need to know how it works — Kiro writes all the code. We just mention it in the prompt so Kiro knows which tool to use, similar to saying "use Excel" when asking someone to make a spreadsheet chart.
You'll see the prompt mentions "matplotlib" — this is a popular Python library for creating charts and visualizations (bar charts, line charts, Gantt charts, etc.). Think of it as the engine that draws the chart image. You don't need to know how it works — Kiro writes all the code. We just mention it in the prompt so Kiro knows which tool to use, similar to saying "use Excel" when asking someone to make a spreadsheet chart.
PROMPT — Copy & paste into Kiro
You are a Senior Project Manager (PMP certified) with 15 years of experience managing cross-functional technology projects. You excel at consolidating scattered information into clear, visual project plans that stakeholders can act on.
I have two files in the project-planning folder:
1. emails.json — contains 8 project emails from team members with task breakdowns, dates, and dependencies
2. project_requirements.txt — a plain-text project brief with phases, milestones, team members, and risks
Build a Python script called timeline_generator.py in the project-planning folder that:
1. Reads both files
2. Extracts all tasks mentioned in the emails, including: task name, owner, start date, end date, dependencies, phase
3. Parses the project brief to get phases, milestones, team allocations, and risks
4. Merges the email-extracted tasks with the project brief data
5. Identifies the critical path (longest chain of dependent tasks)
6. Generates a Gantt chart saved as project_timeline.png with:
- Tasks grouped by phase, color-coded (Discovery=blue, Development=green, Testing=orange, Deployment=red)
- Milestone markers (diamonds) on key dates
- Today line if applicable
- A legend showing phases
7. Prints a text summary to the console showing:
- Total project duration
- Number of tasks per phase
- Critical path tasks
- Any scheduling conflicts or overlaps
- Resource allocation per team member
Use matplotlib for the chart. Read the actual email body text and the plain-text brief to extract dates and tasks.
Install any missing packages automatically. Run the script after creating it.
Step 3: Refine & Export
Add Dependencies
PROMPT 3a — Dependencies
Improve the Gantt chart:
1. Add dependency arrows between tasks that depend on each other
2. Highlight the critical path tasks with a red border
3. Save both charts in a single PNG file with two subplots
Regenerate the chart.
Generate HTML Report
PROMPT 3b — HTML Report
Create an HTML report called project_report.html in the project-planning folder that includes:
1. Project header with name, dates, sponsor, and budget
2. The Gantt chart image embedded
3. A task table with columns: Task, Phase, Owner, Start, End, Duration, Dependencies
4. A milestones table with date and type
5. A risks section from the project requirements
6. A resource summary showing each team member's total allocated days
Professional theme with green (#00B14F) accent. Open it in the browser.
Simulate a Delay
PROMPT 3c — Delay Simulation
The payment API vendor integration was delayed by 5 days (from April 28 to May 3). Add a function that recalculates all downstream task dates based on this delay and generates a comparison Gantt chart showing original vs. adjusted timeline side by side. Highlight tasks that shifted in red. Show the new projected go-live date.
What You Accomplished
- 📧 Parsed unstructured emails and extracted project tasks, dates, and dependencies
- 🔗 Merged data sources — combining email content with structured requirements
- 📊 Generated professional Gantt charts with phases and milestones
- ⏰ Simulated delay scenarios and visualized downstream impact